
Data-driven design experiments
Role
Product Designer
Duration
6 weeks
These experiments demonstrate my approach to proposing data-driven design solutions and how I extract insights from the research and data provided to inform design decisions that meet the required Objectives and Key Results (OKRs) and business goals. They're part of an online course - here's the story for context: PetsMatch is a venture-backed company that has raised a $2.5M seed round from a set of notable investors. The product team had about 12 months of 'runway' to operate effectively and meet the business milestones associated with the mobile app.
Q1 - OKR
Improve the user engagement
Q1's goal is to improve user engagement with the mobile app. This is measured by the following OKR: Increase the number of users who like a provided pet match during their first week of app usage above 65%.
Although PetsMatch's Acquisition and Activation figures (app installs, account creation, and onboarding completion) successfully grew to a few thousand monthly users exploring pet recommendations in Q4 of last year, the data shows that they're struggling to retain and convert them:
-
Top-line growth is Strong: app installs are growing at nearly 60% month-over-month, demonstrating excellent market traction.
-
Mid-funnel friction: A significant user drop-off occurs, with 15.5% of users lost during basic account creation and a further 25% loss during the onboarding flow.
-
Low conversion: The business's North Star metric has a low conversion rate, with only about 1% of onboarded users adopting pets, and 84% of new users not engaging with the key 'like' feature within their first week.

Insight
40.5%
of the acquired new users drop off between the account creation and onboarding steps and don’t get to the activation stage.
Insights


A clear correlation between the 'Lika a pet' feature and the increase in time spent on the app, which can positively impact the Engagement and Retention rates.
87seconds
is the median time users engage with recommendations (swiping) before acting (Liking).
User research analysis
First-time pet owners
This research involved speaking with 10 participants across the Los Angeles, New York, and Atlanta metropolitan areas, all of whom plan to adopt a pet within the next three months.
The group featured a diverse age range (20s to 60s), a high-income bracket (with the majority earning $80k+), and a balanced split between urban and suburban living. Notably, 50% of the participants were first-time pet owners, underscoring the need to design the experience with users new to pet ownership and still exploring their options.
Faster onboarding
“I was confused by the sign-up and following steps in the app...should I just switch all the toggles on and see what happens? Why not!”
Insight
8/10
participants from the user research found the onboarding steps time-consuming (with the average time on task of 2:12 minutes) and added little value to that early stage of discovering the app.

Insight
4/10
participants mentioned that they’re looking at multiple adoption websites along with PetsMatch and expect to get a quick aggregate view of all available pets in their area.
Check multiple adoption websites
“Saturday mornings, I’m having coffee and going through all the pets I could adopt. This could be the one!”

Problem statement
High cognitive load
Users exploring new apps often face high friction during signup and onboarding, which demands effort they aren't ready to commit to in the early, casual exploration phase (the users are in System One thinking). This friction risks overwhelming potential users before they can evaluate the app's core value, leading to high drop-off rates before full adoption.
The data show that between the signup and onboarding steps, 40.5% of the newly acquired users drop off and don't reach the activation stage. 8 out of 10 participants from the user research found these two steps time-consuming and added little value to the early stage of discovering the app. Additionally, 4 out of 10 users mentioned that they're looking at multiple adoption websites, along with PetsMatch, and expect to get a quick, aggregate view
of all available pets in their area.
Proposed solution
Frictionless discovery experience
The problem highlights three areas that could benefit from improvements to achieve the Q1 OKR: increasing the number of users who like a provided pet match during their first week of app usage to above 65%.
-
Replaced the 4-step onboarding flow with filters. After signing up, users are directed to the home page to browse pet recommendations immediately. This change encourages immediate engagement, where a guided tour then prompts users to use filters (location, type, etc.), facilitating content personalisation and a faster progression to taking action (like a pet recommendation).
-
Replace swiping cards with infinite scrolling cards to enhance user experience, drawing on familiar social media mental models. This change aims to boost engagement and increase time spent on the homepage.
-
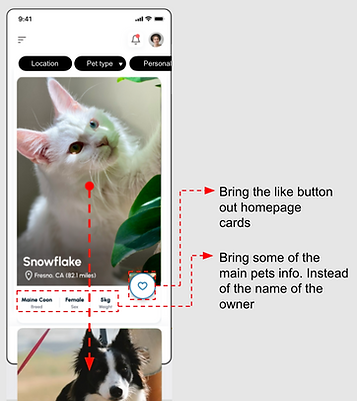
Bring the like button and key pet information to the pet cards for a quick overview without needing to navigate to the individual pet page at this stage.
Proposed solution - part 1
Filters with a guided tour
Replace the onboarding flow with filter tags with a guided tour that allows users to refine their search by location, type, size, age, and personality of pets. This change aims to get the users to the homepage right after signing up, where they can dive into the enjoyable experience of browsing pet photos.
Leading the users through a natural progression: from interest to evaluation to action—liking pets. After about 87 seconds of engagement (the median time spent swiping), a guided tour pop-up will prompt users to set their search location, followed by steps to personalise their search. The aim is to help users become acquainted with the app at their own pace and discover what it has to offer. As they navigate this journey, we encourage them to use the filters to refine their pet recommendations, which will facilitate more liking and engagement with the content.
View the before: Onboarding steps

Proposed solution - part 2
Infinite scrolling for a seamless experience
Replace the swiping cards with infinite scrolling cards to create a more enjoyable and seamless experience, drawing inspiration from established mental models that many users are already familiar with in social media. This change aims to boost engagement and increase the time spent on the homepage.
View the before: Swiping cards

Proposed solution - part 3
Accelerating liking and faster matching
Bring the like button and essential pet information onto the pet cards. By providing a quick overview, users can rapidly evaluate a pet without needing to navigate away from the main feed. This shortens the path to action, encouraging more frequent use of the core "like" feature, which directly increases user engagement, refines pet recommendations faster, and ultimately improves the conversion goal of finding more potential matches.
Success criteria
Increase time engaged - time spent browsing
Increasing the time spent looking at pets by turning it into an enjoyable experience can increase engagement (first like). It also allows the users to discover what they're looking for at their own pace, gradually.
Primary metrics to monitor:
-
Measure the time spent on the homepage.
-
Monitor the Activation - Accounts Created matrix.
-
Monitor the adoption of the new filter feature.
-
Track the number of users who interact with the guided tour.
KPIs
-
Increase the number of users reaching the homepage
-
Increase the time users spend in the app.
-
Increase the number of users who "like" a pet within the first week of using the app.
-
Achieve the target 70 usability score (SUS).
Q2 - OKR
Encourage more pet adoptions
After Q1, PetsMatch has more active users liking the pet matches it provides. Unfortunately, those users aren't following through on adoptions, so the company has set the following Q2 objective:
Increase pet adoptions from relevant matches to 15% of 'liked' pets within 2 weeks from first engagement.
Summary from the data team:
PetsMatch's Q1 acquisition metrics indicate healthy growth. In March, mobile app installations increased by 56.6%, with 95% of users creating accounts after installation. The onboarding process saw a significant improvement, with a 5x reduction in the drop-off rate. As a result, the Activation OKR (which measures users 'liking' of a pet match) rose to 50.14% in March.
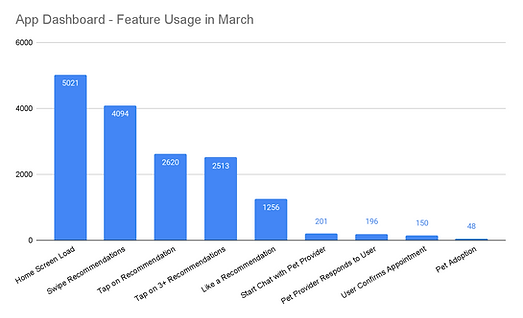
However, retention remains a challenge, as only 25% of Weekly Active Users (WAUs) are retained each month. Engagement data for March reveals a total of 6,104 Likes. The most common actions include loading the Home Screen (5,921 times) and Swiping Recommendations (4,094 times). However, there is a notable drop in high-intent actions, such as starting a chat (1,256 times) and completing a pet adoption (only 48 times). The adoption rate is low, with just 0.6% of liked pets being adopted within two weeks. This is primarily due to an average of 2.5 weeks needed to initiate a conversation and see the pet.

Insight
4%
of users who ‘like’ a pet start conversations with pet providers each week, and it takes an average of 2.5 weeks from the moment a pet is liked by a user to adoption.
7/10
of users didn’t realise they needed to speak with the pet owner to set up a viewing.
The majority of those users don’t seem to realise they may be competing with other users to adopt the pet they’re interested in, and that the same pet may be listed on other sites, increasing the chance of them missing out.
Proposed solution
Overlay tags - A/B test
To achieve the company's Q2 OKR, the proposed solution leverages social proof and Fear Of Missing Out (FOMO) by introducing small tag overlays on pet recommendation cards that display key metrics, such as "X people are viewing this pet" and "X people contacted this provider." This approach aims to give users clear, urgent social validation to drive high-intent action.
I propose an A/B test to rigorously validate the impact of this feature on key conversion metrics before scaling it to production.
What was tested in the treatment: Adding overlay tags to the pets' recommendation cards' images.
Population and duration: Included 2,302 per design, total = 4,604. Over a time period of 3 weeks.
Tracked metrics: The Click Through Rate (CTR) of the recommendation cards that contain tags and the Retention - Weekly Conversation to measure the impact of the treatment designs.
Results
Control / Baseline Rate (Current Design): 13%
Anticipated Treatment Rate (Design Variation): 15%.

More information on the results and the objectives for the following quarter will be added soon!
Come back again :)